Graphviz
Utilisation
Graphviz permet de créer rapidement des diagrammes à partir de fichier text. La disposition des éléments n’est pas gérer par l’utilisateur mais par le programme lui même.
On peut trouver graphviz sur le site qui lui est dédié http://www.graphviz.org/
il existe trois grand programmes de génération # dot # neato # twopi
chacun de ces programmes génèrent des diagrammes différents
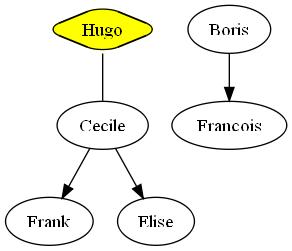
exemple de fichier dot
digraph G {
    A1 -> A3 [arrowhead = none];
    A3 -> A5;
    A3 -> A6;
    A2 -> A4;
    A1 [fillcolor=yellow, style="rounded,filled", shape=diamond, label="Hugo"];
    A2 [label="Boris"];
    A3 [label="Cecile"];
    A4 [label="Francois"];
    A5 [label="Frank"];
    A6 [label="Elise"];
}
pour générer le fichier avec le programme dot par exemple
dot -Tjpg -omonImage.jpg monGraphe.dot
le résultat
vous pouvez trouver plus d’explication sur les paramètres sur ces pages http://www.graphviz.org/doc/info et voir les pages
- node shapes
- dot language
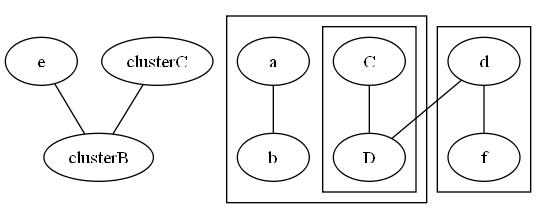
exemple de graphique avec des sous graphique
graph G {
  e
  subgraph clusterA {
    a -- b;
    subgraph clusterC {
      C -- D;
    }
  }
  subgraph clusterB {
    d -- f
  }
  d -- D
  e -- clusterB
  clusterC -- clusterB
}
le résultat
un autre exemple qui incorpore du HTML et des images
digraph sample{
    nodesep=.35;
    ranksep=0.8;
    edge [fontsize=11,labelfontsize=11];
    node [fontsize=11,height=.35,width=.55];
    bgcolor="#FFFFFF";
    ratio=auto;
    compound=true;
    remincross=true;
    searchsize=500;

    a -> b -> c;
    b -> d;
    a [shape=plaintext,label=<<TABLE BORDER="0" CELLBORDER="0" CELLSPACING="0" CELLPADDING="0"><TR><TD ALIGN="RIGHT"><IMG SRC="C:\delete.png"/></TD><TD ALIGN="LEFT"><FONT POINT-SIZE="12" FACE="italic" COLOR="#000000">AbstractCollection</FONT></TD></TR></TABLE>>, URL="http://www.redmine.org"];
    b [label="Wiki link", URL="[[WikiSamplePage]]"];
  }
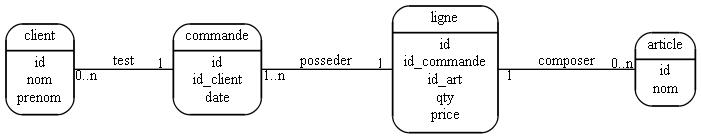
on peut même créer des modèles merise complet
digraph sample{
    nodesep=.35;
    ranksep=0.8;
    edge [fontsize=11,labelfontsize=11];
    node [fontsize=11,height=.35,width=.55];
    bgcolor="#FFFFFF";
    ratio=auto;
    compound=true;
    remincross=true;
    searchsize=500;

    graph [ rankdir = "LR"];

    a -> b  [ label = "generer", headlabel ="1", taillabel = "0..n", label = "test" ,arrowhead = none ];
    b -> c  [ label = "posseder",headlabel ="1", taillabel = "1..n", arrowhead = none];
    c -> d  [label = "composer", headlabel ="0..n", taillabel = "1", arrowhead = none];
    a [ label = <client|id<BR/>nom<BR/>prenom > shape = Mrecord ];
    b [ label = <commande|id<BR/>id_client<BR/>date> shape = Mrecord ];
    c [ label = <ligne|id<BR/>id_commande<BR/>id_art<BR/>qty<BR/>price> shape = Mrecord ];
    d [ label = <article|id<BR/>nom> shape = Mrecord ];
  }
Python
On peut utiliser un module python pour générer des graphs via graphviz.
Pour cela on utilise le module pydot
pip install pydot
Note
il est possible d’avoir l’erreur “Couldn’t import dot_parser, loading of dot files will not be possible.” il faut alors
pip uninstall pyparsing
pip install -Iv https://pypi.python.org/packages/source/p/pyparsing/pyparsing-1.5.7.tar.gz#md5=9be0fcdcc595199c646ab317c1d9a709
pip install pydot
Exemple de script python:
graph = pydot.Dot('graphname', graph_type='digraph')
subg = pydot.Subgraph('', rank='same')
subg.add_node(pydot.Node('a'))
graph.add_subgraph(subg)
subg.add_node(pydot.Node('b'))
subg.add_node(pydot.Node('c'))
Et encore
# -*- coding: utf-8 -*-
import pydot
graph = pydot.Dot(graph_type='graph')

for i in range(3):
    edge = pydot.Edge("king", "lord%d" % i)
    graph.add_edge(edge)

vassal_num = 0
for i in range(3):
    for j in range(2):
        edge = pydot.Edge("lord%d" % i, "vassal%d" % vassal_num)
        graph.add_edge(edge)
        vassal_num += 1

graph.write_png('example1_graph.png')